1918 dataset details how pandemics spread
January 19, 2021

Ten Computer Science students, including Stanley Fujimoto and Eric Burdett, have been instrumental in using handwriting recognition to find which people died in the 1918 pandemic in the United States. To create the dataset, students identified and retrieved hundreds of thousands of relevant images from FamilySearch.
“That’s been quite a process because their collections are just massive,” said Burdett, who wrote computer code to interface with FamilySearch’s system. “We have access to millions and millions of records from FamilySearch, resources a lot of researchers haven’t had before.”
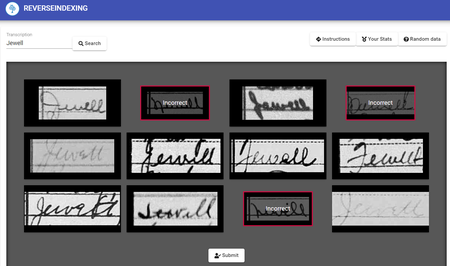
To teach the computer to extract relevant entries from certificates with varying layouts, Fujimoto modified and trained object detection algorithms typically used to identify people or cars in images. The students in the lab transcribe causes of death using a state-of-the-art handwriting recognition algorithm created by former BYU graduate student Curtis Wigington. Once they obtain the transcriptions, students assign a diagnosis code to the certificates to standardize differing ways coroners described the same cause of death. The automated process has allowed them to transcribe over 100,000 death records in under 2 hours, compared with the weeks or months of labor that human-generated transcriptions require.
For many, involvement in the project will shape their professional futures.
“This project is giving us the skills to be able to function in jobs in big fields in computer science like machine learning and artificial intelligence,” Burdett said.
As for Fujimoto—despite his past indifference to genealogy—seeing cutting-edge computer science and machine learning applied to family history has inspired him to take a full-time position as a data scientist with Ancestry.com.
“Sometimes in school we are focused so much on theory, and I love that I can see that the things we’ve been learning can actually make a difference,” said Burdett, who joined the team more recently and replaced Fujimoto as the student project leader when the latter graduated this past summer.
“You can actually plot the curve by gender, age and race and analyze the data alongside the 1918 city-and county-level interventions to see which were most successful,” Price explained. “So when you look at a policy about when local governments chose to close the schools, you can look at the curve of deaths for school-age children to determine whether the closures helped.”
Their preliminary research suggests that the death rate for the 1918 outbreak was about twice as high in U.S. cities that chose not to implement any interventions, compared to those that did.
The first dataset is now available at pandemic.familytech.byu.edu.
For more details see:
- https://www.ksl.com/article/50092702/byu-researchers-link-poor-1918-pandemic-intervention-efforts-to-higher-death-rates-why-that-matters-now
- https://news.byu.edu/intellect/byu-student-driven-1918-dataset-details-how-pandemics-spread
- In the past, researchers could plot the curve of 1918 pandemic deaths based on how many people died in a given place at a given time, but they couldn’t break those numbers down into more detailed patterns. Price realized that they could generate more specific curves by linking each individual’s cause of death to other previously indexed attributes on the certificates.

